Japanese candlestick charts are a popular tool used in technical analysis to visualize price movements of financial assets such as stocks, bonds, commodities, and currencies. Developed in Japan in the 18th century, this charting technique has been widely used in financial markets across the world. In this blog, we will explain what Japanese candlesticks are, the different types of candles, and how to use them to predict trends.
What is a Japanese Candlestick?
Japanese candlestick is a type of chart pattern used in technical analysis to show price changes on financial markets like stocks, currencies, and commodities. Its shape, which mimics a candle with wicks on both ends, gave rise to its name.
Every candlestick includes four pieces of information: the opening price, the closing price, the highest price, and the lowest price during that time period. Each candlestick represents a particular time period, such as a day, week, or month. The wicks (or shadows) of the candlestick stand in for the highest and lowest prices, while the candlestick’s body symbolises the opening and ending prices.
The colour of the candlestick can indicate whether the closing price was higher or lower than the opening price. If the closing price is higher than the opening price, the candlestick is typically coloured green. If the closing price is lower than the opening price, the candlestick is typically coloured red.

Japanese candlesticks are used to identify patterns and trends in price movements, which can help traders make informed decisions about buying or selling assets.
Different Types of Japanese Candlesticks
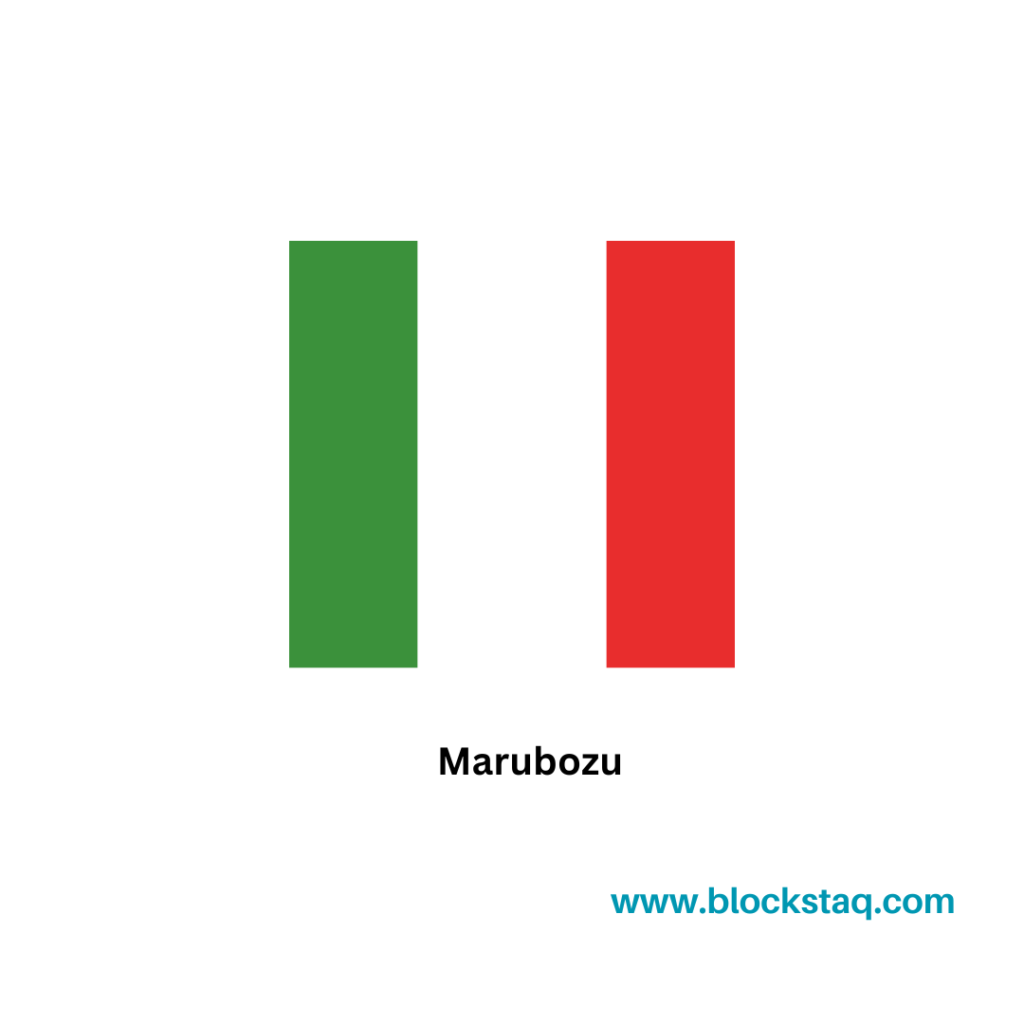
Marubozu –
A Marubozu candlestick has no upper or lower wick and represents a strong trend in either direction. There are two types of Marubozu candlesticks: bullish Marubozu and bearish Marubozu.
A bullish Marubozu has a long body with no upper or lower wick which indicates that the market is strongly bullish.
A bearish Marubozu has a long body with no upper or lower wick which indicates that the market is strongly bearish.
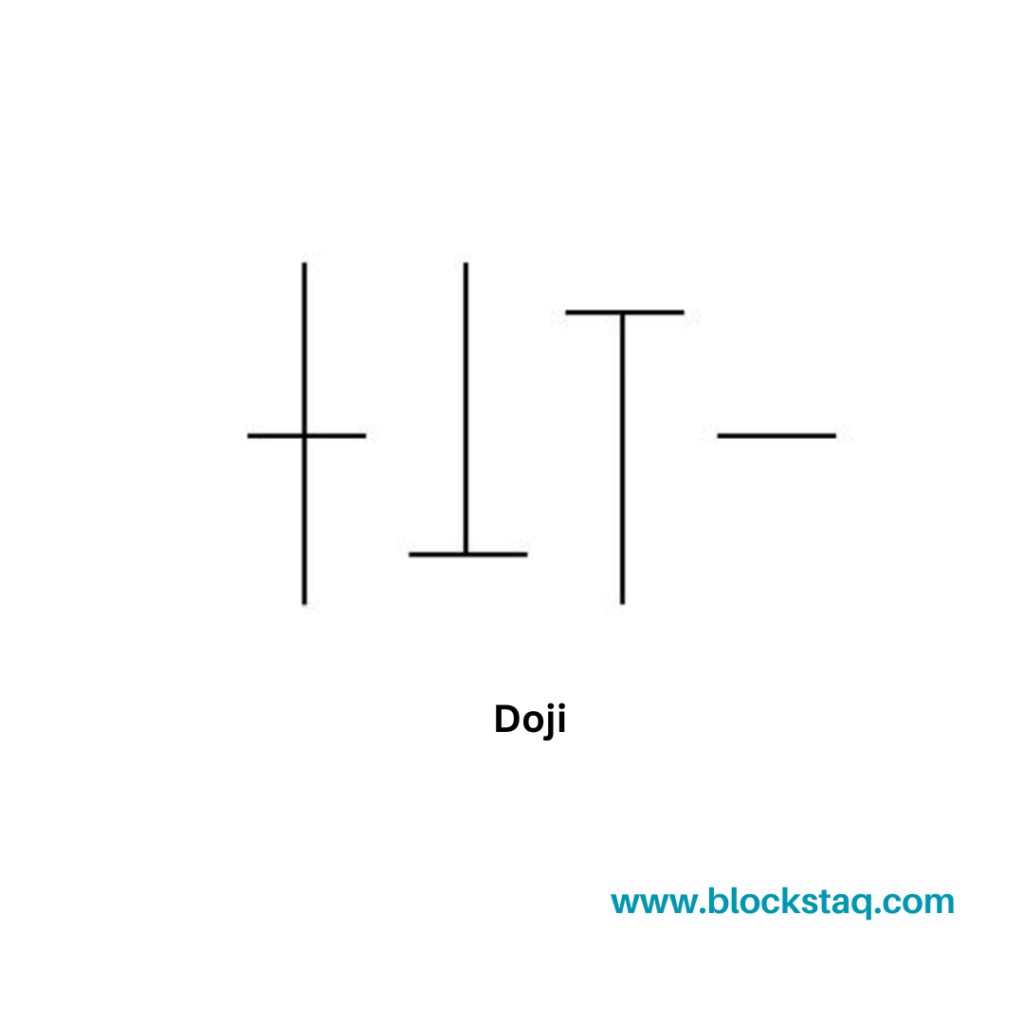
Doji –
A Doji candlestick has the same opening and closing price and indicates indecision in the market. There are four types of Doji candlesticks: neutral Doji, long-legged Doji, gravestone Doji, and dragonfly Doji.
A neutral Doji has a small body and shows that the market is undecided.
A long-legged Doji has long upper and lower wicks which indicate that the market is volatile.
A gravestone Doji has a long upper wick and no lower wick, indicating that the market opened high but closed low.
A dragonfly Doji has a long lower wick and no upper wick, indicating that the market opened low but closed high.
Hammer –
A Hammer candlestick has a small body and a long lower wick, indicating a bullish reversal. There are two types of Hammer candlesticks: bullish Hammer and inverted Hammer.
A bullish Hammer has a small body, a long lower wick, and a short or no upper wick, indicating that the market opened low but closed high.
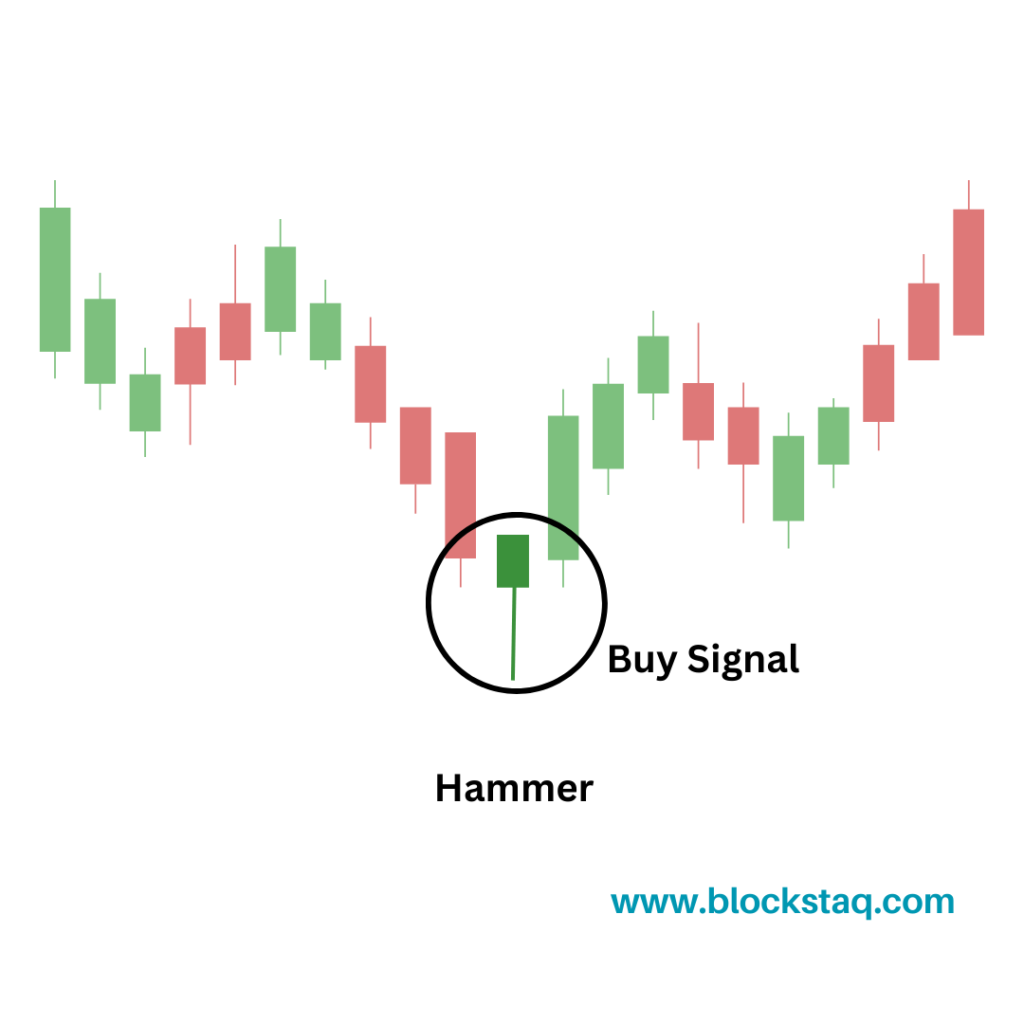
An inverted Hammer has a small body, a long upper wick, and a short or no lower wick, indicating that the market opened high but closed low.

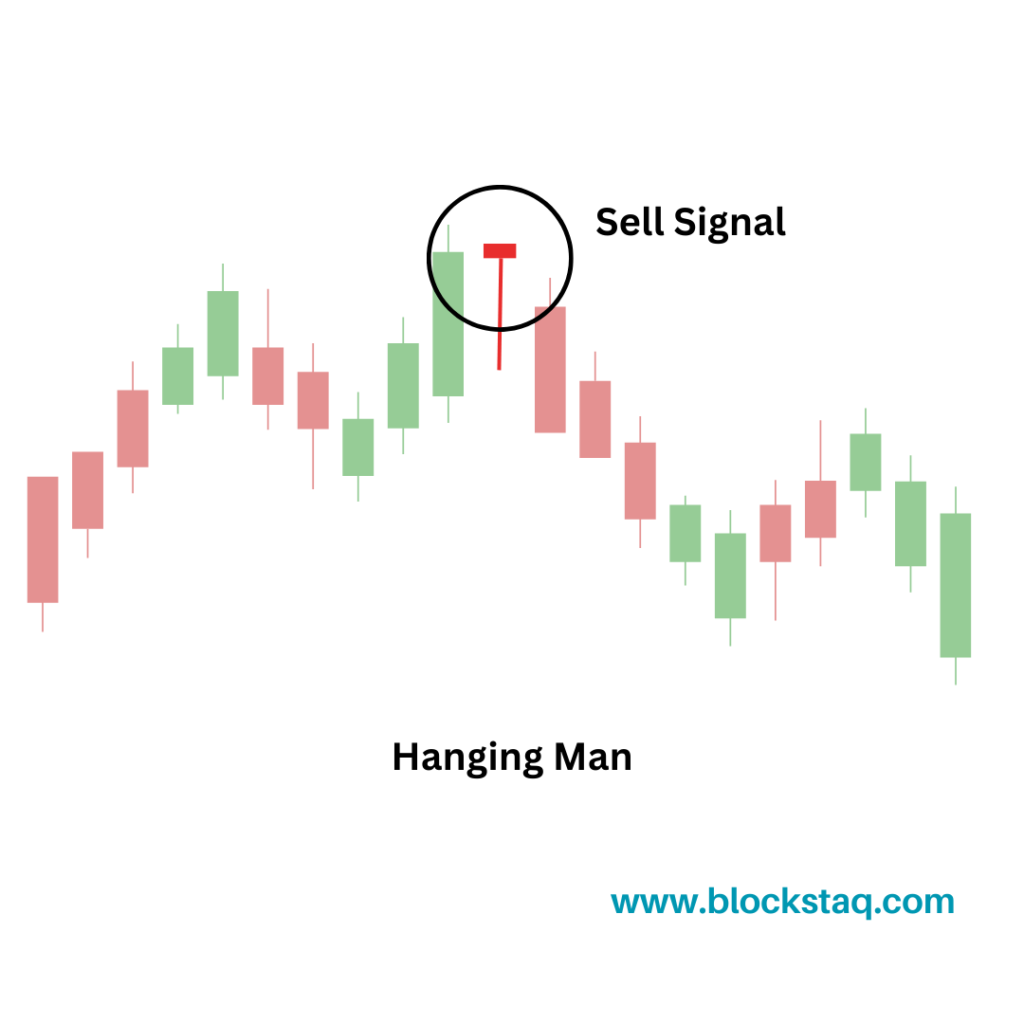
Hanging Man –
A Hanging Man candlestick has a small body and a long lower wick, indicating a bearish reversal. There are two types of Hanging Man candlesticks: bearish Hanging Man and inverted Hanging Man.
A bearish Hanging Man has a small body, a long lower wick, and a short or no upper wick, indicating that the market opened high but closed low.
An inverted Hanging Man has a small body, a long upper wick, and a short or no lower wick, indicating that the market opened low but closed high.
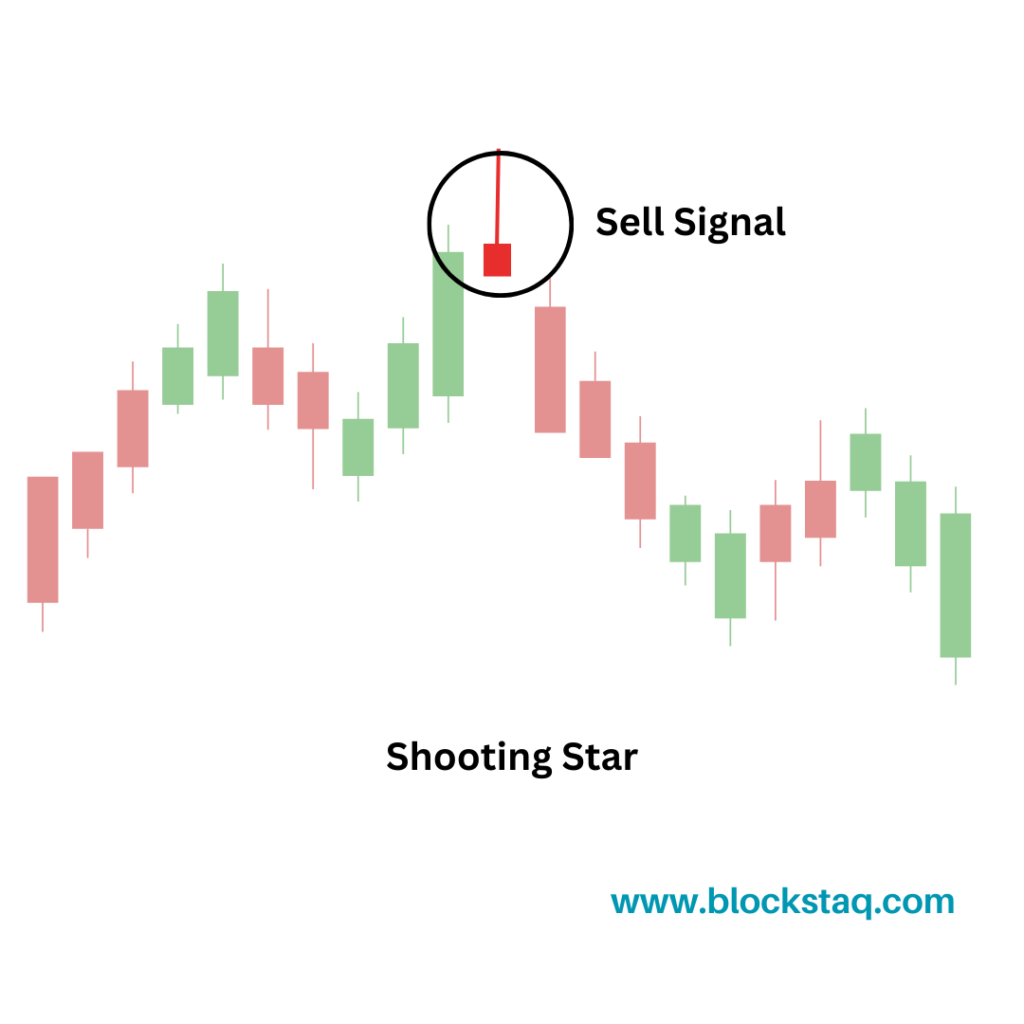
Shooting Star –
A Shooting Star candlestick has a small body and a long upper wick, indicating a bearish reversal.
Traders often use this pattern as a signal to sell or go short on a security, as it suggests that the uptrend may be coming to an end. However, it is important to consider other technical indicators and market factors before making any trading decisions based solely on this pattern.
Spinning Top –
A Spinning Top candlestick has a small body and both upper and lower wicks, indicating indecision in the market. There are two types of Spinning Top candlesticks: bullish Spinning Top and bearish Spinning Top.
A bullish Spinning Top has a small body and both upper and lower wicks, indicating that the market opened and closed at similar levels, but there was volatility during the day.
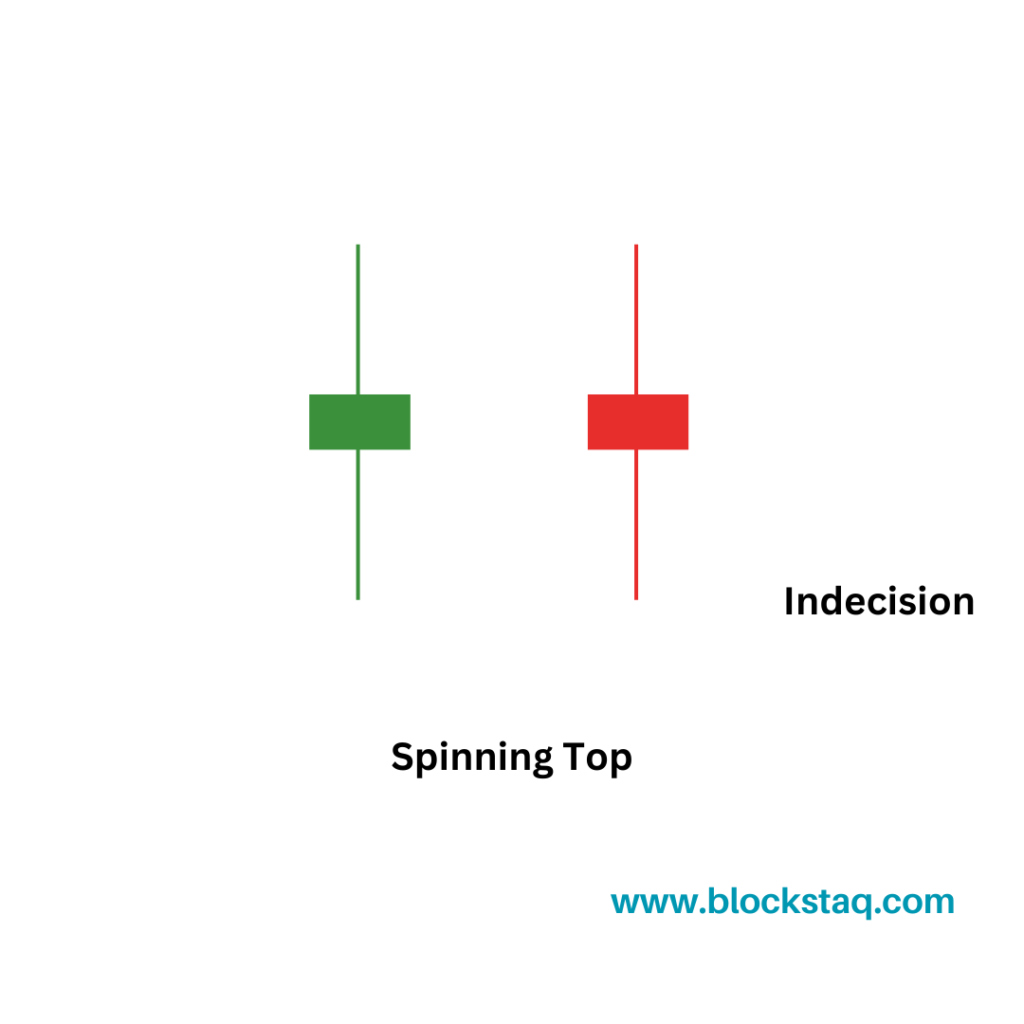
A bearish Spinning Top has a small body and both upper and lower wicks, indicating that the market opened and closed at similar levels, but there was volatility during the day.
These are just some of the most common types of Japanese candlesticks, and there are many more variations and patterns that can be used to predict the trend
Predicting Trends with Japanese Candlesticks
Japanese candlesticks can be used to predict trends in the market by analyzing the patterns and formations that they create. Here are some common patterns and what they indicate:
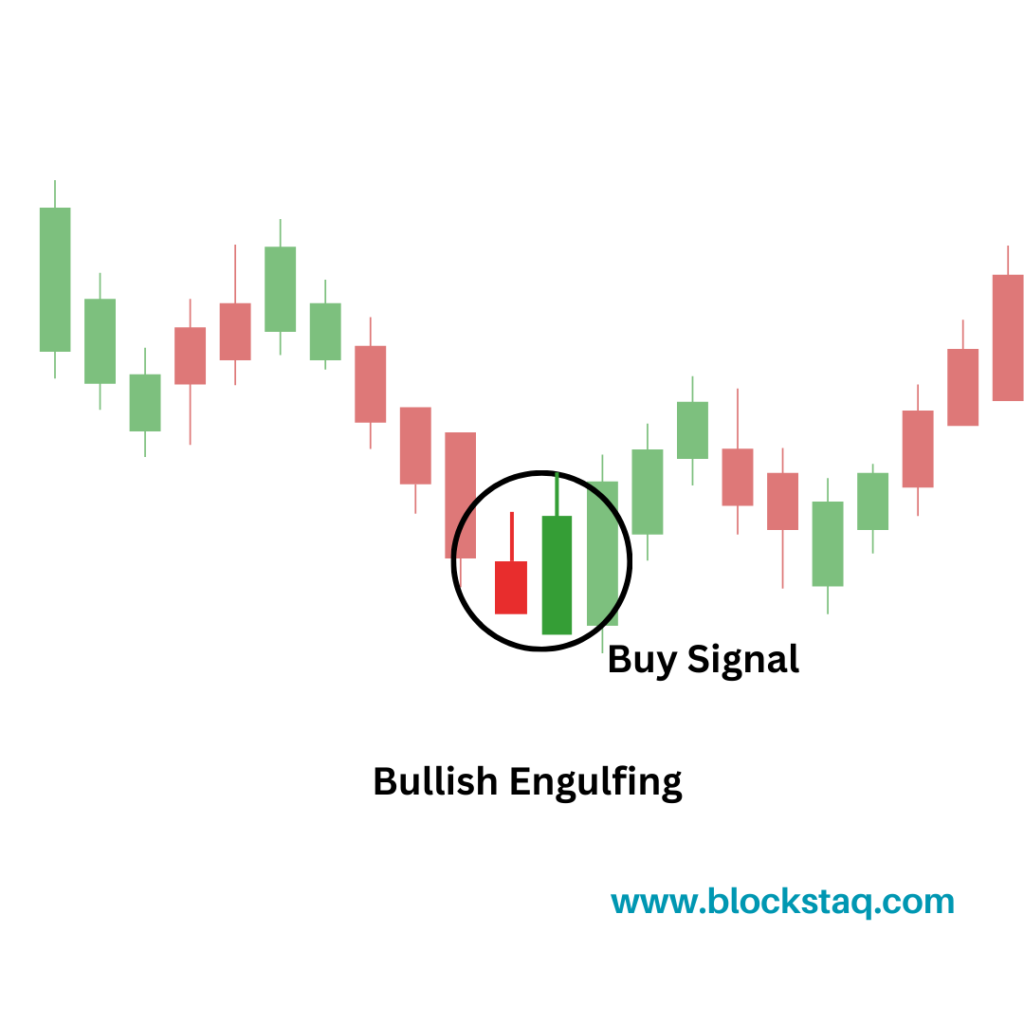
Bullish Engulfing:
A Bullish Engulfing pattern occurs when a small bearish candle is followed by a larger bullish candle that completely engulfs the body of the first candlestick. indicating a potential bullish trend reversal.
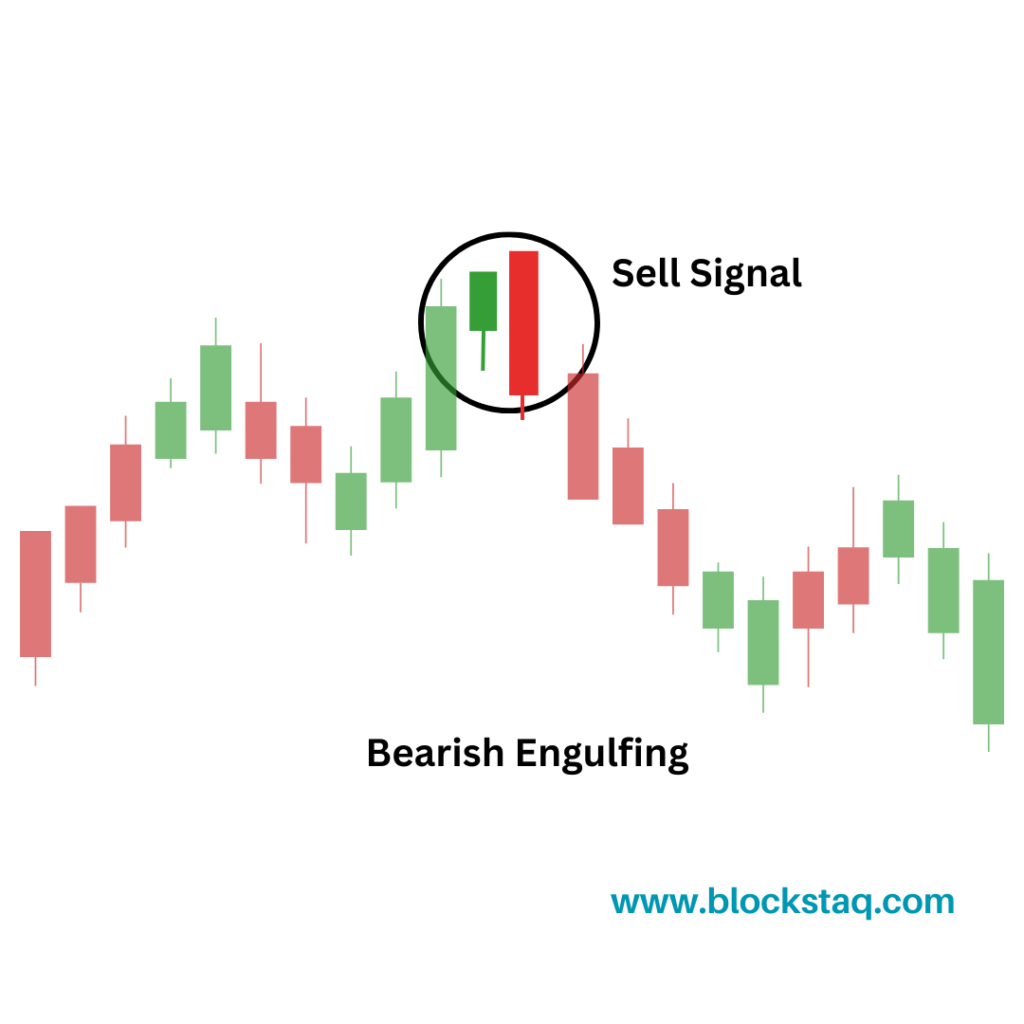
Bearish Engulfing:
A Bearish Engulfing pattern occurs when a small bullish candle is followed by a larger bearish candle, indicating a potential bearish trend reversal.
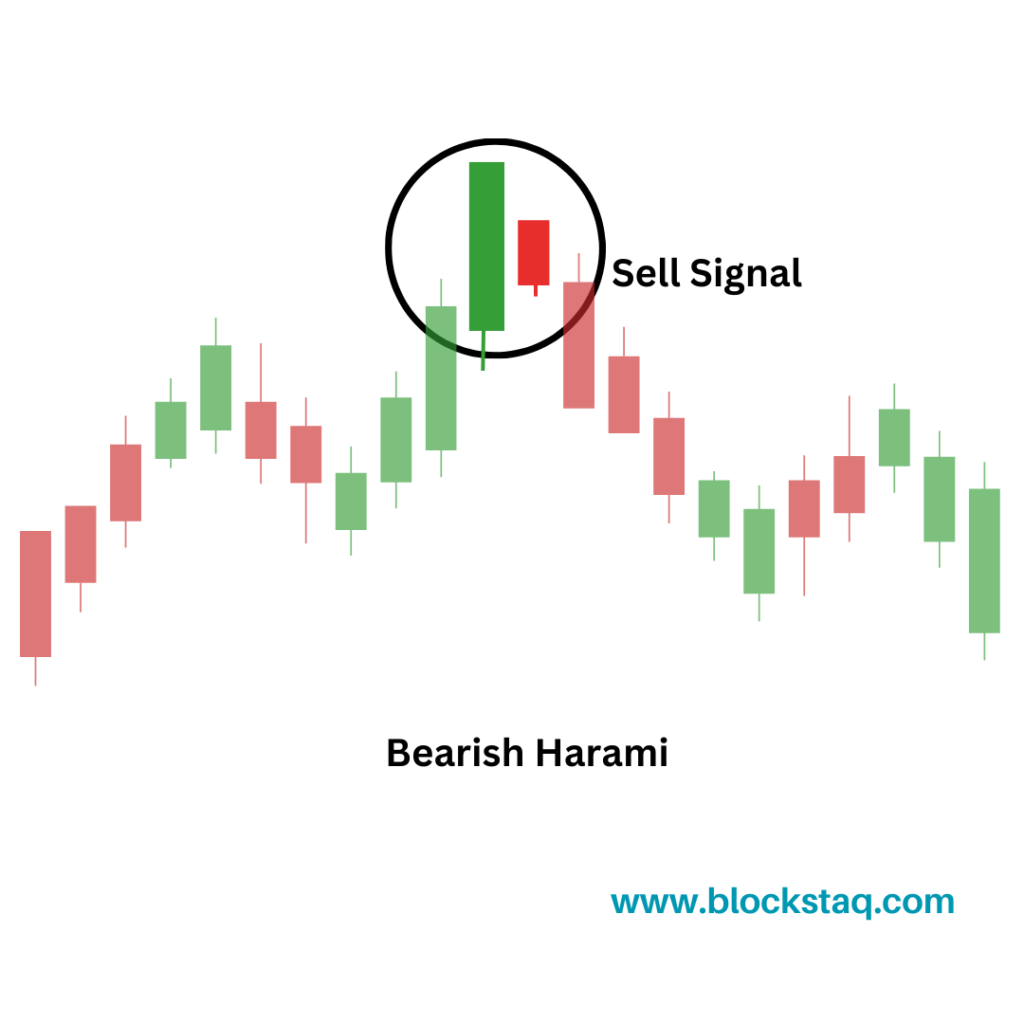
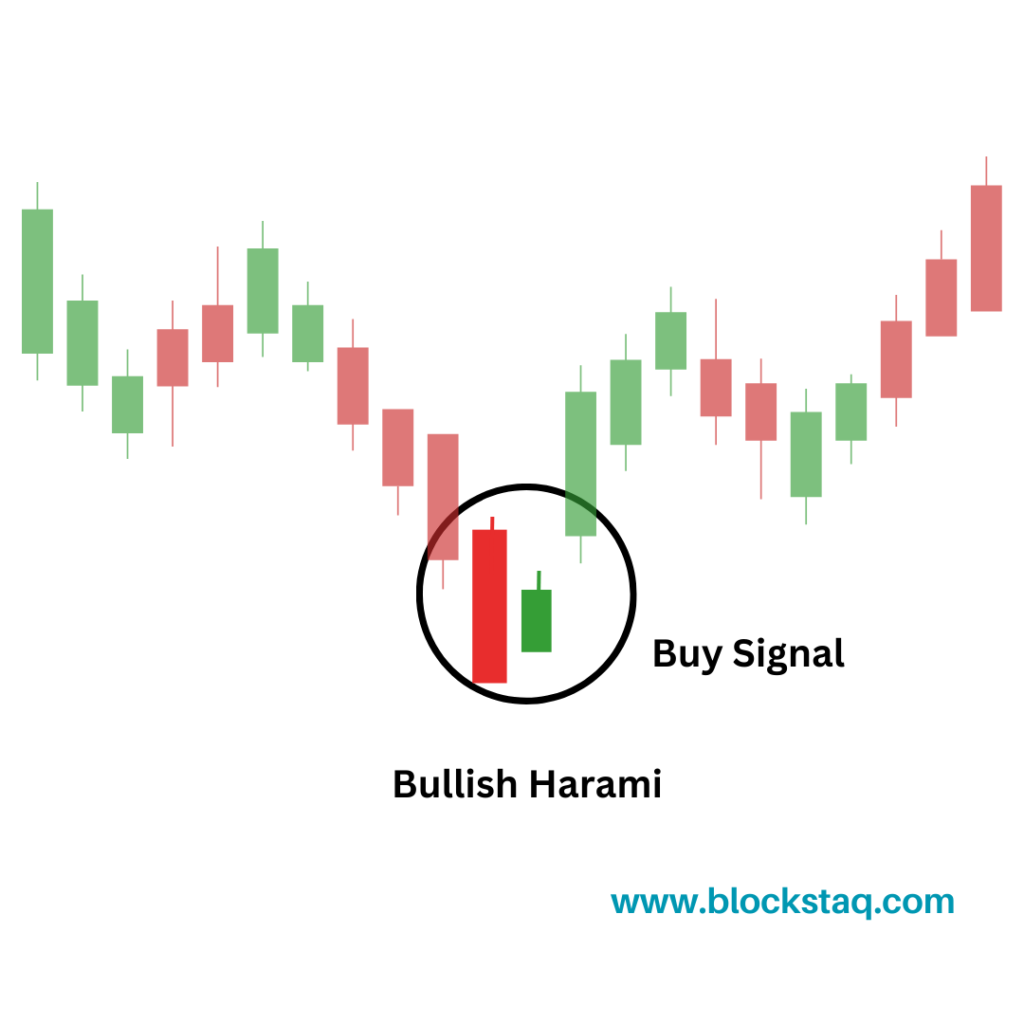
Harami:
A Harami pattern occurs when a small candle is followed by a larger candle with the opposite color, indicating a potential trend reversal.
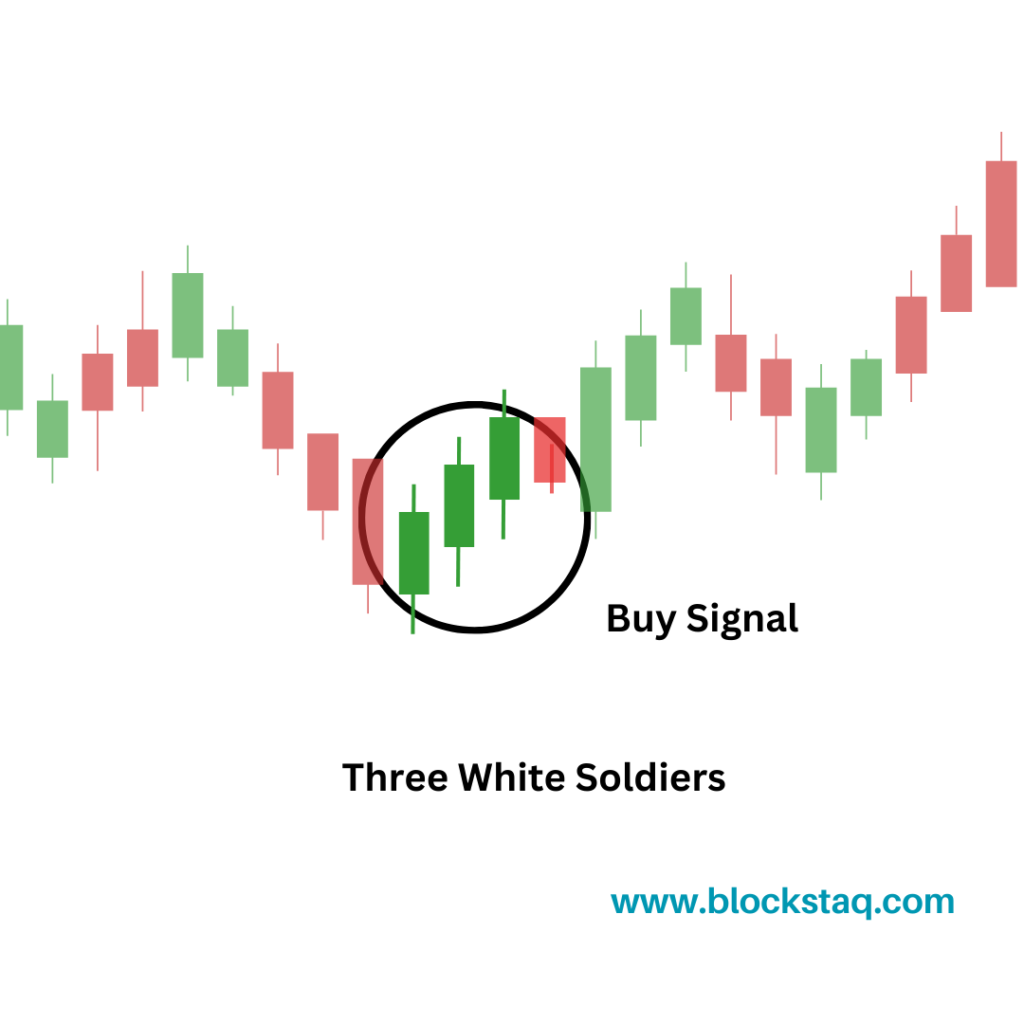
Three White Soldiers:
A Three White Soldiers pattern occurs when three consecutive bullish candles occur, indicating a strong bullish trend.
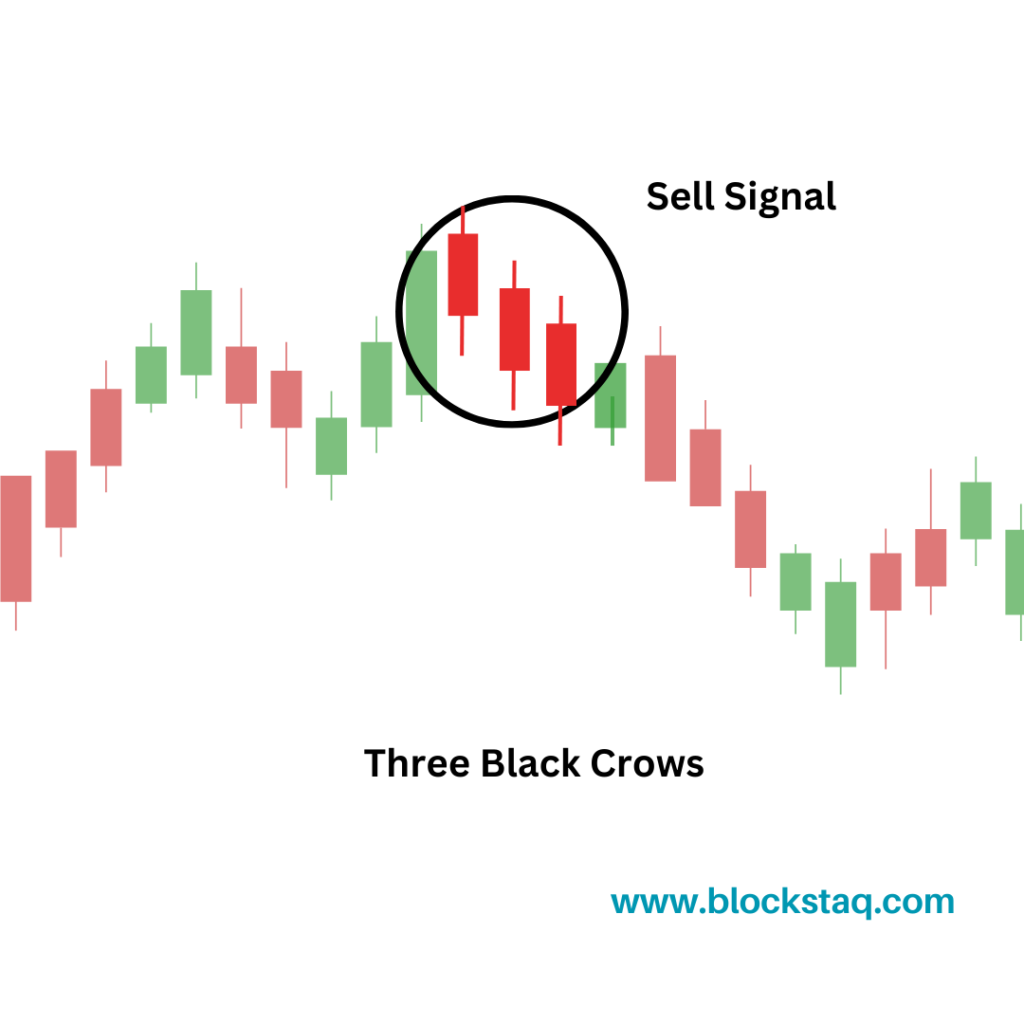
Three Black Crows:
A Three Black Crows pattern occurs when three consecutive bearish candles occur, indicating a strong bearish trend.
Conclusion
Japanese candlesticks are a powerful tool for technical analysts to predict market trends. By analyzing the different types of candlesticks and the patterns they form, traders can make more informed decisions about when to buy and sell assets. However, it is important to note that no trading strategy is foolproof and that there is always a risk involved in investing
Read – How to invest in nifty & Bank Nifty
Disclaimer– The information provided in this blog is for educational and informational purposes only and should not be construed as financial advice. The stock market can be volatile and subject to sudden changes, and past performance is not necessarily indicative of future results. Before making any investment decisions, it is important to do your own research and consult with a licensed financial advisor. The author and publisher of this blog are not responsible for any losses or damages incurred as a result of following the information provided in this blog.
